Posts: 16
Threads: 7
Joined: Oct 2019
Reputation:
0
Hi,
I've been observing the following while profiling our game:

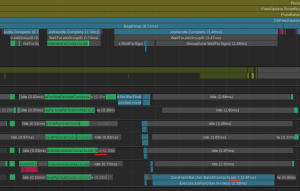
Is this the expected ratio of idle time to job execution or is there anything we can do to utilize the threads more efficiently?
Granted, we are running this on a mobile processor, but we've optimized our cloth meshes and simulation parameters as far as possible.
Posts: 6,610
Threads: 27
Joined: Jun 2017
Reputation:
432
Obi Owner:
14-04-2021, 10:14 AM
(This post was last modified: 14-04-2021, 10:25 AM by josemendez.)
(14-04-2021, 09:52 AM)JanikH Wrote: Hi,
I've been observing the following while profiling our game:
Is this the expected ratio of idle time to job execution or is there anything we can do to utilize the threads more efficiently?
Granted, we are running this on a mobile processor, but we've optimized our cloth meshes and simulation parameters as far as possible.
Hi there,
Depends a lot on what your setup looks like, this might be normal or maybe it could be improved.
Let me explain some stuff first: physics simulation in general and cloth in particular can't be 100% parallelized, since interactions/constraints between bodies (for instance a contact between to particles/rigidbodies) usually require modifying some property of these bodies. For instance, changing the velocity of two particles when they collide with each other.
This means writing data to some memory location. Multiple threads writing to the same memory location -modifying the same particle- would lead to a race condition and potentially cause a crash or at the very least give incorrect results. Using synchronization primitives (mutexes, spinlocks) to protect access to each particle from multiple threads would negate any multithreading benefits, as it's slow.
For this reason constraints are grouped or batched in a way that no two constraints in the same batch affect the same particle. This way, constraints within the same batch can be safely solved in parallel, but different batches must be processed sequentially. There's a very watered-down explanation of this in the manual: http://obi.virtualmethodstudio.com/tutor...aints.html
At runtime Obi will merge and reorganize constraints from different cloth actors in the solver so that the minimum amount of batches is produced, maximizing parallelism. Most constraints are pre-batched during blueprint generation (distance, bend, tethers, etc) and some others are batched at runtime (contacts, friction) because they're created and destroyed dynamically.
With this in mind, this is the pseudocode for one simulation step in Obi:
Code: // find contact constraints
// batch contact constraints
// solve all constraints
foreach constraint type
{
for (int i = 0; i < iterations; ++i)
{
foreach batch in constraint type
{
parallel foreach constraint in batch
solveConstraint();
}
}
}
In your profiler pic, there's 3 clear cut things happening:
- Finding contacts (fully parallel)
- Sorting/merging contacts into batches for efficient paralellization. (parallel operation followed by sequential one)
- Solving all constraints (a sequence of parallel operations, as in the pseudocode above).
![[Image: fOZRl21.png]](https://i.imgur.com/fOZRl21.png)
The one taking most time is constraint solving (the pseudocode loop above). I have no idea what's happening in there (as the work done by each individual thread is not clearly visible in the screenshot) but it probably means there's either many independent batches or many iterations, which hurts parallelism.
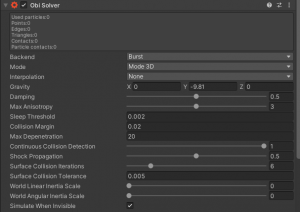
Could you share your solver settings, and some more info about your scene?
Posts: 16
Threads: 7
Joined: Oct 2019
Reputation:
0
14-04-2021, 10:38 AM
(This post was last modified: 14-04-2021, 10:43 AM by JanikH.)
Thanks for the elaborate information!
I was assuming job dependencies are likely the reason.
I believe the scene is rather simple:
- 1 BoxCollider (Ground)
- 1 MeshCollider using a distance field
- 1 to 8 Cloth actors with 32 particles each; closed convex shape with small particles; surface collisions are enabled because I need somewhat robust collisions between the actors:

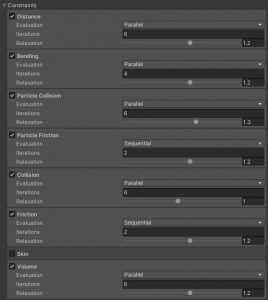
Solver settings:
- Fixed timestep is around 0.033, the game is capped at 30 fps


I'm not modifying any simulation parameters at runtime, only evaluating the particle collisions.
I hope this information can be of use.
I was wondering if this code might lead to a situation where jobs are not scheduled when they could be?
Code: BurstConstraintsImpl.cs
public void ScheduleBatchedJobsIfNeeded()

{

    if (scheduledJobCounter++ > 16)

    {

        scheduledJobCounter = 0;

        JobHandle.ScheduleBatchedJobs();

    }

}
I'm probably just misunderstanding the scheduling process.
Posts: 6,610
Threads: 27
Joined: Jun 2017
Reputation:
432
Obi Owner:
14-04-2021, 10:49 AM
(This post was last modified: 14-04-2021, 11:09 AM by josemendez.)
Hi Janik,
I'd say the culprit is your constraint settings: you're using 4-6 iterations for most of them, and using parallel evaluation too.
The thing with parallel evaluation mode is that it converges much more slowly than sequential, that is, it gives more stretchy results. This forces you to use more iterations to get a result similar to what you'd get with sequential mode, which makes it more costly.
Note that "parallel" in this context doesn't have anything to do with multithreading, it refers to the way constraint adjustments are applied to particles: in parallel mode all constraints are solved, then their results averaged and applied to particles. In sequential mode, the result of solving each constraint is immediately applied after solving it. In physics literature parallel mode is known as "Jacobi", and sequential mode as "Gauss-Seidel".
As a result, parallel mode gives smoother but more stretchy results. You should always use sequential unless you got a very good reason to use parallel (such as avoiding biasing). See:
http://obi.virtualmethodstudio.com/tutor...olver.html
Quote:Parallel mode converges slowly and isn't guaranteed to conserve momentum (things can sometimes gain energy). So use sequential mode when you can, and parallel mode when you must.
Also, using substeps is generally better than using iterations. When you need to increase simulation quality, you should just increase the amount of substeps. Then maybe fine tune each individual constraint by adjusting iteration count. See: http://obi.virtualmethodstudio.com/tutor...gence.html
So I'd start with 3 substeps, 1 iteration for all constraint types and set them all to sequential. That should both look and perform better.
Posts: 6,610
Threads: 27
Joined: Jun 2017
Reputation:
432
Obi Owner:
14-04-2021, 11:16 AM
(This post was last modified: 14-04-2021, 11:35 AM by josemendez.)
(14-04-2021, 10:38 AM)JanikH Wrote: I was wondering if this code might lead to a situation where jobs are not scheduled when they could be?
Code: public void ScheduleBatchedJobsIfNeeded()
{
if (scheduledJobCounter++ > 16)
{
scheduledJobCounter = 0;
JobHandle.ScheduleBatchedJobs();
}
}
Scheduling jobs has an associated cost, and worker threads can't start working on a job that's not been scheduled. For this reason, scheduling jobs immediately after creating them is not a good idea because this will happen:
Code: Main thread schedules job (workers wait)--->worker threads process the job---->Main thread schedules another job (workers wait)-----> worker threads process the job.....
The workers finish their job quickly and they have to wait for the main thread to schedule more stuff, wasting time they could spend working. This is specially true when you have many small jobs (one job per batch in Obi's case). Pushing jobs only when we have a significant amount of work to do (16 jobs in this case) results in this:
Code: Main thread schedules 16 jobs(workers wait)--->Main thread schedules another 16 jobs(workers still working on the previous 16)--->Main thread schedules another 16 jobs(workers still working on the previous 16).... etc
This way both the main thread and the workers are always busy, and you avoid starving the thread pool.
In your profiler pic, you can see a big JobHandle.Complete() in the main thread that takes 13 ms. That's the main thread waiting for the workers to finish processing all the jobs that have been scheduled. This is a very good thing because it means that the workers do not have to wait for the main thread, but the other way around: all workers are busy, working on whatever job dependency chain they need to get done.
Posts: 16
Threads: 7
Joined: Oct 2019
Reputation:
0
Thank you again, this is great advice. I adjusted our parameters and the simulation definitely runs faster now and converges much quicker.
I did in fact read through a lot of the documentation, but I guess I underestimated the performance impact of parallel evaluation. The tip about increasing substeps instead of iteration is something I must have missed completely.
In general I think it's a bit weird for these nuggets about performance optimization to be hiding throughout the docs. Maybe it would be better to consolidate them into a dedicated page, especially seeing how often performance is mentioned on this forum.
One last thing:

The ConstriantBatcher.BatchContactsJob is marked with the [BurstCompile] attribute, however it's not actually being Burst compiled?
Profiled on an Android device.
Posts: 6,610
Threads: 27
Joined: Jun 2017
Reputation:
432
Obi Owner:
14-04-2021, 03:13 PM
(This post was last modified: 14-04-2021, 03:19 PM by josemendez.)
(14-04-2021, 02:53 PM)JanikH Wrote: The tip about increasing substeps instead of iteration is something I must have missed completely.
In general I think it's a bit weird for these nuggets about performance optimization to be hiding throughout the docs. Maybe it would be better to consolidate them into a dedicated page, especially seeing how often performance is mentioned on this forum.
This is general stuff applicable to all physics engines, so not a lot of emphasis is put on the documentation. All physics simulation must chop up time into time steps of some sort, the shorter the timestep (== the more steps per frame) the better quality you get.
I do realize that it's not immediately obvious stuff though (unless you've dealt with a fair share of other engines), so gradually I'm trying to cover more general simulation concepts in the manual. You make a good point, some fellow asset developers in Unity have proposed the same to me. I will probably add to the manual a sort of technical FAQ that condenses "recipes" for common use cases and tips to avoid typical pitfalls. Thanks for the suggestion! 
(14-04-2021, 02:53 PM)JanikH Wrote: The ConstriantBatcher.BatchContactsJob is marked with the [BurstCompile] attribute, however it's not actually being Burst compiled?
Profiled on an Android device.
That's weird, will take a look and get back to you.
Posts: 16
Threads: 7
Joined: Oct 2019
Reputation:
0
(14-04-2021, 03:13 PM)josemendez Wrote: This is general stuff applicable to all physics engines, so not a lot of emphasis is put on the documentation. All physics simulation must chop up time into time steps of some sort, the shorter the timestep (== the more steps per frame) the better quality you get.
I do realize that it's not immediately obvious stuff though (unless you've dealt with a fair share of other engines), so gradually I'm trying to cover more general simulation concepts in the manual. You make a good point, some fellow asset developers in Unity have proposed the same to me. I will probably add to the manual a sort of technical FAQ that condenses "recipes" for common use cases and tips to avoid typical pitfalls. Thanks for the suggestion!
That's weird, will take a look and get back to you.
Hi, I was wondering if there are any updates on the job not being Burst compiled? It is costing me few ms I would like to save.
Posts: 6,610
Threads: 27
Joined: Jun 2017
Reputation:
432
Obi Owner:
31-05-2021, 01:50 PM
(This post was last modified: 31-05-2021, 01:51 PM by josemendez.)
(31-05-2021, 11:09 AM)JanikH Wrote: Hi, I was wondering if there are any updates on the job not being Burst compiled? It is costing me few ms I would like to save.
Hi there!
I've been unable to get it to behave like you describe. Afaik, that can only happen if the job doesn't have the [BurstCompile] attribute (it should) or if Burst compilation is disabled. Otherwise the job (and any other jobs with [BurstCompile]) will be Burst compiled:
![[Image: g2E7rA9.png]](https://i.imgur.com/g2E7rA9.png)
Do other jobs appear as Burst compiled in your profiler?
Posts: 16
Threads: 7
Joined: Oct 2019
Reputation:
0
(31-05-2021, 01:50 PM)josemendez Wrote: Hi there!
I've been unable to get it to behave like you describe. Afaik, that can only happen if the job doesn't have the [BurstCompile] attribute (it should) or if Burst compilation is disabled. Otherwise the job (and any other jobs with [BurstCompile]) will be Burst compiled:
![[Image: g2E7rA9.png]](https://i.imgur.com/g2E7rA9.png)
Do other jobs appear as Burst compiled in your profiler?
Excuse me for reusing the same screenshot I used above, but I think it does show the issue:

The (Burst) postfix is truncated, bit you can definitely see it in a few places. Notably, the BatchContactsJob is lacking this postfix. It is also colored differently than the Burst compiled jobs, although I might have come to the wrong conclusion about the colors.
This was profiled on the Android target device and I'm certain the rest of the jobs are Burst compiled.
I'm still using the version 6.0.1, not sure if it was fixed with the latest release.
|


![[Image: fOZRl21.png]](https://i.imgur.com/fOZRl21.png)

![[Image: g2E7rA9.png]](https://i.imgur.com/g2E7rA9.png)