Thread Rating:
  • 0 Vote(s) - 0 Average
  • 1
  • 2
  • 3
  • 4
  • 5
Possible memory leak?
#1
Hi

I recently found that a memory leak in my scene stops if I disable the Obi solver.
I intend to try to reproduce this in a new smaller scene later, to do a better report, but for now I would like your opinion about this.

I'm using the last Obi version, in the last Unity 2019.4.22, and Windows 7 (64 bit).
My scene has 3 Obi clothes, each near an Obi Spherical Force (to simulate wind), and also around 20 gameobjects with Obi colliders and Obi rigidbodies (all of them Non Kinematic to particles).
I also have the Obi rope an Obi softbody assets in the project, but haven't added any of those elements yet.

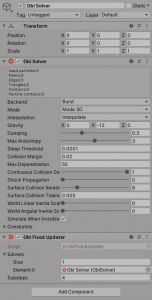
The solver is configured like this:
   

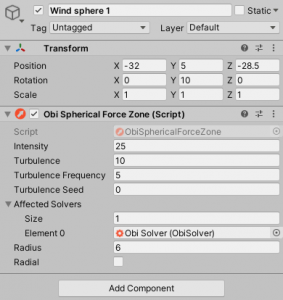
The Obi force is like this: (if I disable the gameobjects with these forces the leak still happens, so I don't think they are related)
   

The leak happens in the editor and in PC builds, and you could say that it "eats" 1GB of ram in something like 200 seconds, so the application ends crashing after some time.

Other problem that I have seen, that I don't know if is related to the leak, is that if I have the solver enabled, but disable the 3 Obi clothes (that are children of the Obi solver object), then I start getting errors like these:
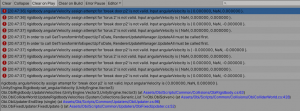
   

This is for some of the objects that have Obi colliders and Obi rigidbodies.
If you have an Obi solver maybe you need to have at least some Obi particles in the scene?
Reply
#2
(24-03-2021, 03:11 AM)LogaNRV Wrote: Hi

I recently found that a memory leak in my scene stops if I disable the Obi solver.
I intend to try to reproduce this in a new smaller scene later, to do a better report, but for now I would like your opinion about this.

I'm using the last Obi version, in the last Unity 2019.4.22, and Windows 7 (64 bit).
My scene has 3 Obi clothes, each near an Obi Spherical Force (to simulate wind), and also around 20 gameobjects with Obi colliders and Obi rigidbodies (all of them Non Kinematic to particles).
I also have the Obi rope an Obi softbody assets in the project, but haven't added any of those elements yet.

The solver is configured like this:


The Obi force is like this: (if I disable the gameobjects with these forces the leak still happens, so I don't think they are related)


The leak happens in the editor and in PC builds, and you could say that it "eats" 1GB of ram in something like 200 seconds, so the application ends crashing after some time.

Hi there!


I'm unable to spot any leaks in my tests. Can you share a screenshot of the profiler in memory mode? I can't think of any potential memory leaks, specially not when using the Burst backend as everything is C#. Data arrays for the solver are lazily allocated once when first used, then destroyed together with the solver. There's no native allocations being made every frame.

(24-03-2021, 03:11 AM)LogaNRV Wrote: This is for some of the objects that have Obi colliders and Obi rigidbodies.
If you have an Obi solver maybe you need to have at least some Obi particles in the scene?

It shouldn't matter whether you have particles or not in the solver, it's not required. These errors don't seem to be related to the solver or particles, but the ObiRigidbody component.

Setting invalid (Infinite, NaN) velocity values to a rigidbody will cause Unity to spew these errors. Every frame ObiRigidbody reads the velocity value, adds or subtracts from it, then assigns it back. If the value was invalid to begin with, this error will also be triggered upon trying to assign the velocity back. Can you describe how are your rigidbodies set up? (do they have joints of any kind, are there other scripts setting forces/impulses/velocities?)
Reply
#3
Here is the game after 5 minutes in the editor (I just start the scene, don't interact with anything), with the Obi solver disabled (and the 3 clothes):
   

The numbers stay mostly stable all that time.

And after that I enable the Obi solver and the clothes, and run the scene for another 5 minutes:
   

Those are the numbers after 5 minutes.

More info:
- If I use the Oni solver instead of Burst the leak doesn't happen.
- When using Oni, the previous NaN error can still happen for some objects, but only for one frame (not every frame like with Burst).
- The speed of the leak seems proportional to the number of clothes enabled.

My Burst (Jobs) config in the editor:
- JobsDebugger off
- Leak Detection Off
- Burst: Safety Checks Off
- Burst: Native Compilation
- Burst: Synchronous Compilation

Some packages:
- Burst 1.4.6
- Jobs 0.2.10-preview.13
- Collections 0.9.0-preview.6
- Mathematics 1.2.1

In general my non kinematic physic objects have a renderer, a collider, a rigidbody, an Obi collider, an Obi rigidbody and one script that I use to define "buoyancy" info for when the objects fall in my water zones (it doesn't have an Update, only a Start() to define some variables).
There are also kinematic physic objects and zones with triggers, to apply different type of forces to the non kinematic objects and the players.
There are only a few non kinematic objects attached with static joints, at the start of the scene.
But in general most of the objects start in the scene isolated from other forces (until the player start interacting with them).

I think is possible that there is something wrong in my scene, because of the error. I hope to have time on the weekend to try to reproduce this in a smaller scene.

I have the Memory Profiler package installed, but have not been able to play much with it yet.
Reply
#4
There's a pretty large memory leak in 0.2.0's and below NativeQueue (used only by the Burst backend) that I reported here: https://forum.unity.com/threads/memory-l...ue.814668/

This leaked memory whenever colliders are used in the scene. Could it be a regression in 0.9.0? Can you try deactivating collisions in the solver and see if that stops the leak?

Let me know if this is not the case. I will investigate further.
Reply
#5
I assume you mean disabling "collision" in the constrains?
I tried disabling every constrain in the end Sonrisa
And.. I found a combination that stops the leak: disabling "particle collision" and "density":
   

I saw your report and the speed of the leak seems similar.
Maybe trying and older version of collections could help?
Reply
#6
(27-03-2021, 02:15 AM)LogaNRV Wrote: I assume you mean disabling "collision" in the constrains?
I tried disabling every constrain in the end Sonrisa
And.. I found a combination that stops the leak: disabling "particle collision" and "density":


I saw your report and the speed of the leak seems similar.
Maybe trying and older version of collections could help?

Particle collisions and density both use NativeQueue to generate constraints. Disabling them would stop any use of queues, so this really smells like a regression of the memory leak in NativeQueue.

Will try updating to your version of the Collections package and see if that reproduces it. You can try downgrading collections, that should help.
Reply
#7
I downgraded Jobs/collections to previous versions but the leak was still there.
I went back to Jobs 0.2.8-preview.3, Collections 0.7.1-preview.3, but at that point the Obi solver seems to fall back to Oni.
So then I tried replicating the package versions in your "backends" page:

Burst 1.3.3
Collections 0.8.0-preview 5
Mathematics 1.0.1
Jobs 0.2.9-preview.15

But I could downgrade Mathematics only to version 1.1.0 then.
And with those versions the leak is still there.

After that I returned to the newer version of all the packages and noticed that there was a new Burst version available (1.5.0).
Installed it but started to get this error a lot: (so it was unusable)
   

So in the end I went back to Burst 1.4.6.
I think I will use it like that when I need frame rate (but with the leak), or will use Oni when I need stability for now x)

The behavior of the leak was always the same in every test, if I disble particle collisions and density, it stops.

Thinking it better I can live without the "particle collisions" and "density" constrains for now, and still use Burst.

Forgot to test this before, but I also get the leak in some of the Obi sample scenes for cloth, like the Wind scene:
   
Reply
#8
Hi there Sonrisa
Sorry for the necropost, but I thought it made more sense than a new one since it's related to this issue.
In Obi Cloth v6.0.1 I'm also seeing a large leak with the Particle Collision constraint enabled. My test setup is as follows:
-Use the "Wind" Obi Cloth sample scene
-Remove Solver 2 and Fan
-Add an object with the following script to log memory use (quicker for this and the mem profiler)
Code:
using UnityEngine;
using UnityEngine.Profiling;

public class MemoryLogger : MonoBehaviour
{
    const float MemMultiplier = 1.0f / (1024 * 1024);

    [SerializeField]
    private float baselineDelaySecs = 10.0f;
    [SerializeField]
    private float updatePeriodSecs = 1.0f;

    private float timer;
    private float baselineTimer;
    private float baselineTimeSinceStart;
    private long baselineAllocatedMem;

    void OnEnable()
    {
        baselineTimer = baselineDelaySecs;
        timer = updatePeriodSecs;
    }

    // Update is called once per frame
    void Update()
    {
        if (baselineTimer > 0.0f)
        {
            if ((baselineTimer -= Time.deltaTime) < 0.0f)
            {
                baselineTimeSinceStart = Time.realtimeSinceStartup;
                baselineAllocatedMem = Profiler.GetTotalAllocatedMemoryLong();
                string message = $"Baseline mem in use: {baselineAllocatedMem * MemMultiplier:f1}MB.";
                Debug.Log(message);
            }

            return;
        }

        if ((timer -= Time.deltaTime) < 0.0f)
        {
            long memAllocated = Profiler.GetTotalAllocatedMemoryLong();
            int timeSinceBaseline = (int)(Time.realtimeSinceStartup - baselineTimeSinceStart);
            float memDeltaSinceBaseline = memAllocated - baselineAllocatedMem;
            string message = $"Mem in use: {memAllocated * MemMultiplier:f1}MB. " +
                             $"Time since baseline: {timeSinceBaseline/60}:{timeSinceBaseline%60}. " +
                             $"Mem delta since baseline: {memDeltaSinceBaseline * MemMultiplier:f1}MB";
            Debug.Log(message);
            timer = updatePeriodSecs;
        }
    }
}

My package versions are as follows:
-Burst 1.3.0-preview.12
-Collections 0.9.0-preview.6
-Mathematics 1.1.0

I have run the test you described in the unity forum thread, reproduced the massive leak in collections in a pre-0.2.0 version of that package (wow!) and confirmed it does not exist in 0.9.0. There does still seem to be a much smaller leak, but nowhere near that.

Now with the above setup, built to an executable to ensure no editor shenanigans, my output after a minute is as follows:
"Mem in use: 221,4MB. Time since baseline: 1:0. Mem delta since baseline: 150,3MB"

The leak continues at this pace as long as I leave the app running.

If I disable just the Particle Collision constraint on Solver 1, there is no leak.
Reply
#9
Hi there,

Thanks for the report! Will try to reproduce this and get back to you. I've been bitten by leaks in Collections before (including but not limited to the huge leak in 0.2.0 queues), but since this is limited to particle collision constraints it does seem to stem from Obi's own memory handling.

will investigate and report back.
Reply
#10
(14-01-2022, 08:48 AM)josemendez Wrote: Hi there,

Thanks for the report! Will try to reproduce this and get back to you. I've been bitten by leaks in Collections before (including but not limited to the huge leak in 0.2.0 queues), but since this is limited to particle collision constraints it does seem to stem from Obi's own memory handling.

will investigate and report back.
Hi. did you find and fixed it.
Reply