Posts: 7
Threads: 1
Joined: Jul 2021
Reputation:
0
We use Obi Rope to simulate a fire hose in our game. Simulation works great except for the performance. When the rope is active in the scene the games FPS drop from 150 to 60.
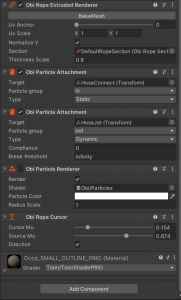
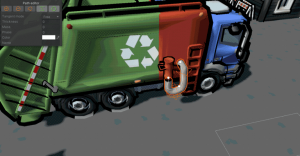
We use only one rope with one fixed and one dynamic end. The whole simulation is attached to a moving truck.
This is our configuration:
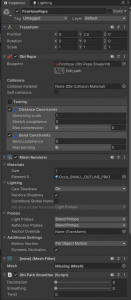
Rope Blueprint: Thickness: 0.2; Resolution: 1; Particles: 100


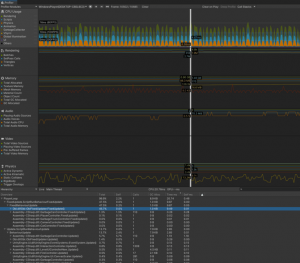
When profiling in Debug Build mode you can see that the Obi simulation makes up for nearly 50% of the processing time.

(Better Quality: https://www.dropbox.com/s/qjyq3so7z0rvnh...7.png?dl=0)
There are no noticeable changes in performance whether the car is moving or stationary or whether the end of the rope is picked up by the player. Performance also gets better when disabling the rope altogheter. We aren't modifying any rope properties via script except the ropes' length when it is picked up, which doesn't seem to have an impact on performance.

We are using Obi 5.6 but upgrading to the most recent version had no effect. Similar scenarios from the demo scenes perform great and with no problems (1000FPS and more) which is kinda strange as our settings doesn't seem to be that different from the example settings.
Am I missing something? Thanks in advance!
Posts: 6,597
Threads: 27
Joined: Jun 2017
Reputation:
431
Obi Owner:
15-07-2021, 01:08 PM
(This post was last modified: 15-07-2021, 01:20 PM by josemendez.)
Hi,
What platform are you building for?
Is this being tested on a mobile device or a desktop computer?
It's not clear to me if this is happening on the standalone build only, or is the same issue is reproducible in-editor?
What are your constraint settings (the constraints foldout in the ObiSolver)? The amount of iterations spent impacts performance, so just to make sure they have sane values.
Do you have colliders near the rope? what kind of colliders? if they're MeshColliders, how complex are they?
Also (just in case) keep in mind that building with deep profiling support enabled will very negatively affect performance even if you're not actually using deep profiling.
Posts: 7
Threads: 1
Joined: Jul 2021
Reputation:
0
(15-07-2021, 01:08 PM)josemendez Wrote: Hi,
What platform are you building for?
Is this being tested on a mobile device or a desktop computer?
It's not clear to me if this is happening on the standalone build only, or is the same issue is reproducible in-editor?
What are your constraint settings (the constraints foldout in the ObiSolver)? The amount of iterations spent impacts performance, so just to make sure they have sane values.
Do you have colliders near the rope? what kind of colliders? if they're MeshColliders, how complex are they?
Also (just in case) keep in mind that building with deep profiling support enabled will very negatively affect performance even if you're not actually using deep profiling.
Hey, thanks for the quick reply!
I'm building for Windows x86_64. This error happens in a standalone build (with and without dev build enabled) and also in editor. I never had deep profiling enabled.
As for the constrains, I checked them and I definetly had more enabled than I needed but all with 1-3 iterations so nothing that should be that bad I guess. Interestingly I've disabled all constrains which had no impact on performance resulting in Obi still taking >50% CPU time.
In terms of colliders, there are a few box and sphere colliders near the rope but nothing too crayz. There are nearly no mesh coliders in the game. I also tried moving the rope to a point where there are no colliders whatsoever. Sadly this changed nothing regarding the performance.
Posts: 6,597
Threads: 27
Joined: Jun 2017
Reputation:
431
Obi Owner:
15-07-2021, 01:47 PM
(This post was last modified: 15-07-2021, 01:47 PM by josemendez.)
If there's no deep profiling enabled, no complex colliders near the rope, and not a lot of constraint iterations spent, I can't really think of a reason for such bad performance.
Would it be possible for you to share your project, or at least one scene that reproduces this so that I can take a closer look? Please send it to support(at)virtualmethodstudio.com. Thanks!
Posts: 7
Threads: 1
Joined: Jul 2021
Reputation:
0
(15-07-2021, 01:47 PM)josemendez Wrote: If there's no deep profiling enabled, no complex colliders near the rope, and not a lot of constraint iterations spent, I can't really think of a reason for such bad performance.
Would it be possible for you to share your project, or at least one scene that reproduces this so that I can take a closer look? Please send it to support(at)virtualmethodstudio.com. Thanks! Yeah that also makes kind of no sense to me. I'll try building a minimal scene with the rope in it where the problem occures as I can't send you the entire project (It's really big and I'm afraid I'm not allowed to send the whole project anyways) I'll hit you up once I've have something I can send to you.
On another note I'm afraid in an isolated context everything will work fine as I tried to put the rope from a Obi demo scene in my scene and for some reason the performance also dropped way down. The PhysicsFixedUpdate of the Obi Fixed Updater took 80ms in my scene and 0.8ms in the demo scene with exactly the same setup. Of course my scene is really complex, with a lot of normal and also Obi colliders but I placed the demo nowhere near any of them floating way above the ground. Maybe this info is of any help.
Posts: 6,597
Threads: 27
Joined: Jun 2017
Reputation:
431
Obi Owner:
15-07-2021, 03:38 PM
(This post was last modified: 15-07-2021, 03:40 PM by josemendez.)
(15-07-2021, 03:20 PM)xeetsh Wrote: Yeah that also makes kind of no sense to me. I'll try building a minimal scene with the rope in it where the problem occures as I can't send you the entire project (It's really big and I'm afraid I'm not allowed to send the whole project anyways) I'll hit you up once I've have something I can send to you.
On another note I'm afraid in an isolated context everything will work fine as I tried to put the rope from a Obi demo scene in my scene and for some reason the performance also dropped way down. The PhysicsFixedUpdate of the Obi Fixed Updater took 80ms in my scene and 0.8ms in the demo scene with exactly the same setup. Of course my scene is really complex, with a lot of normal and also Obi colliders but I placed the demo nowhere near any of them floating way above the ground. Maybe this info is of any help.
What are your project timestep settings? If the exact same rope runs in 0.8 ms in the sample scene but 80 ms in yours, makes me suspect that death spiraling might be the problem.
Look if FixedUpdate() is called more than once per frame in the profiler. That would mean adding the rope puts just enough strain on your scene to send the entire physics loop over the edge and start updating more than once per frame since it can't keep up with rendering.
Also, one thing I just noticed is that you have "Substep Unity physics" enabled in your ObiFixedUpdater, but you're not using substepping at all (just 1 substep/frame). This will make all physics in your scene appear under the ObiFixedUpdater() call in the profiler, as Obi is in charge of updating all physics in the scene when this is enabled. So these 9 ms in your original profiler pic account for the rope, plus all other physics happening in your scene. Not that it really matters, but can be confusing.
Posts: 7
Threads: 1
Joined: Jul 2021
Reputation:
0
(15-07-2021, 03:38 PM)josemendez Wrote: What are your project timestep settings? If the exact same rope runs in 0.8 ms in the sample scene but 80 ms in yours, makes me suspect that death spiraling might be the problem.
Look if FixedUpdate() is called more than once per frame in the profiler. That would mean adding the rope puts just enough strain on your scene to send the entire physics loop over the edge and start updating more than once per frame since it can't keep up with rendering.
Also, one thing I just noticed is that you have "Substep Unity physics" enabled in your ObiFixedUpdater, but you're not using substepping at all (just 1 substep/frame). This will make all physics in your scene appear under the ObiFixedUpdater() call in the profiler, as Obi is in charge of updating all physics in the scene when this is enabled. So these 9 ms in your original profiler pic account for the rope, plus all other physics happening in your scene. Not that it really matters, but can be confusing. Ok, I think you are onto something here! I'm indeed in a death spiral. This is one frame without the rope:

and this is one frame with the loop enabled:

I'm not 100% familiar with the topic but I read a lot yesterday about how Unitys timing works but as I have a fixed delta time of 20ms configured thats the critical point I shouldn't exeed with my delta time. To be fair, with 15ms without the rope, I'm already not that far away from this point and when adding the rope I most certainly exeed this mark and fall into the death spiral.
As you can see I have changed the solver to execute on LateUpdate instead of FixedUpdate as rope is more or less of a cosmetic nature in my game so this should make no difference. This takes away some kind of processing while spiraling but of course isn't enough to stop the game from having more FixedUpdates than Updates.
What I don't get is, that regardless of any death spiraling, as you can see in the second screenshot the ObiLateUpdater.LateUpdate is taking 9.35 seconds is this a normal time for this kind of simulation? Or is this a side effect of the physics simulation being processed multiple times and without this happening this call wouldn't take that long? Because I totally that my frame times are going through the roof because physics is executed more than once but in case of ObiLateUpdater.LateUpdate it's just one execution that takes up half of my "target frame time"
Posts: 6,597
Threads: 27
Joined: Jun 2017
Reputation:
431
Obi Owner:
16-07-2021, 10:31 AM
(This post was last modified: 16-07-2021, 10:33 AM by josemendez.)
Hi!
It is indeed a case of death spiraling, but still the amount time consumed by Obi is far from normal or acceptable, and could very well be causing death spiraling by itself. I believe there's something else going on here. In the worst possible scenario should not take more than a millisecond.
What I'd suggest to do: try disabling constraints in the solver one by one. Start by disabling particle and collider collisions, then bend, then distance. See if it makes any difference along the way. Eventually disable all constraints. If performance hasn't improved considerably by then, disable the ObiRopeRenderer. Report back the results you get, this way we can determine if simulation is the culprit and if so, which kind of constraints. If it isn't, maybe rendering (mesh generation) is.
Posts: 7
Threads: 1
Joined: Jul 2021
Reputation:
0
16-07-2021, 01:46 PM
(This post was last modified: 16-07-2021, 02:26 PM by xeetsh.)
(16-07-2021, 10:31 AM)josemendez Wrote: Hi!
It is indeed a case of death spiraling, but still the amount time consumed by Obi is far from normal or acceptable, and could very well be causing death spiraling by itself. I believe there's something else going on here. In the worst possible scenario should not take more than a millisecond.
What I'd suggest to do: try disabling constraints in the solver one by one. Start by disabling particle and collider collisions, then bend, then distance. See if it makes any difference along the way. Eventually disable all constraints. If performance hasn't improved considerably by then, disable the ObiRopeRenderer. Report back the results you get, this way we can determine if simulation is the culprit and if so, which kind of constraints. If it isn't, maybe rendering (mesh generation) is. Hey,
I've tried disabling all constrains and also the Extruded Renderer, both seem to have no impact on the performance. I've also tried removing everything but "Map Objects" (mosty meshes with colliders) from the scene, especially all behaviours. I now fall into the death spiral anymore and the time for the rope simulation goes down but it's still at 4ms which according to what you have said shouldn't be the case.
Right now I'm in the process of creating a version of the scene I can send to you. Maybe you know a little better where to look.
(15-07-2021, 01:47 PM)josemendez Wrote: If there's no deep profiling enabled, no complex colliders near the rope, and not a lot of constraint iterations spent, I can't really think of a reason for such bad performance.
Would it be possible for you to share your project, or at least one scene that reproduces this so that I can take a closer look? Please send it to support(at)virtualmethodstudio.com. Thanks! I've just sent you the mail with the package. Thanks for looking into this!
Posts: 6,597
Threads: 27
Joined: Jun 2017
Reputation:
431
Obi Owner:
(16-07-2021, 01:46 PM)xeetsh Wrote: I've just sent you the mail with the package. Thanks for looking into this!
Package received! Will take a look at it during the weekend, and get back to you as soon as I find something.
|
