Thread Rating:
  • 0 Vote(s) - 0 Average
  • 1
  • 2
  • 3
  • 4
  • 5
Help  Lag spikes with simple ropes
#1
Hi!

We are currently working on a game that uses Obi Rope (version 5.3) and we are experiencing weird lag spikes every couple seconds (seems random rather than in intervals).
Using the Profiler with Deep Profiling enabled I could boil the source down to the method Oni.OnComplete() often taking 50-100ms. Without deep profiling enabled, I see the Substep as the source of the problem.
There are 11 ropes in the scene. All of the ropes are of the same prefab. These are the settings for the ropes:
   

All ropes use 1 solver, with the following settings:
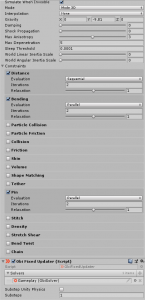
   

The blueprint has a resolution of 0.3 and 10 pooled particles.
The scene itself is rather complex, with around 3k meshes.
Normally the ropes only take about 2-3 ms to compute (simulation & rendering).
The fixed timestep is set to 0.02, the maximum allowed timestep is 0.06.
The Unity version we are using right now is 2019.2.0f1.

Lastly, screenshots of the profiler (in-editor):
With Deep Profiling:
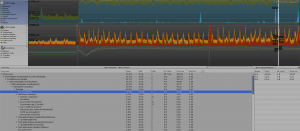
   
Without Deep Profiling:
   

I'll gladly provide more information when needed. Any help is appreciated!
Reply
#2
(27-05-2020, 11:23 AM)monokel Wrote: Hi!

We are currently working on a game that uses Obi Rope (version 5.3) and we are experiencing weird lag spikes every couple seconds (seems random rather than in intervals).
Using the Profiler with Deep Profiling enabled I could boil the source down to the method Oni.OnComplete() often taking 50-100ms. Without deep profiling enabled, I see the Substep as the source of the problem.
There are 11 ropes in the scene. All of the ropes are of the same prefab. These are the settings for the ropes:


All ropes use 1 solver, with the following settings:


The blueprint has a resolution of 0.3 and 10 pooled particles.
The scene itself is rather complex, with around 3k meshes.
Normally the ropes only take about 2-3 ms to compute (simulation & rendering).
The fixed timestep is set to 0.02, the maximum allowed timestep is 0.06.
The Unity version we are using right now is 2019.2.0f1.

Lastly, screenshots of the profiler (in-editor):
With Deep Profiling:

Without Deep Profiling:


I'll gladly provide more information when needed. Any help is appreciated!


Hi there,

We've been unable to reproduce this. Does this happen in editor/in the device/both?
This could be due to death spiraling, as I see in the profiler that FixedUpdate() is called multiple times. However, it could also be the cause of it. Do these spikes take place even when setting the maximum allowed timestep to the same value as the fixed timestep (0.02)?
Reply
#3
(28-05-2020, 08:54 AM)josemendez Wrote: Hi there,

We've been unable to reproduce this. Does this happen in editor/in the device/both?
This could be due to death spiraling, as I see in the profiler that FixedUpdate() is called multiple times. However, it could also be the cause of it. Do these spikes take place even when setting the maximum allowed timestep to the same value as the fixed timestep (0.02)?

Yes, the same thing is happening when I use the same values for maximum allowed timestep and fixed timestep.
It is also happening, both, in Editor and in Build (Desktop).
Specs shouldn't be much of a problem:
i7-7700k 4x4.2Ghz
GTX 1070
32 GB Ram

I could try to setup a small repro project, i guess that would be helpful?

EDIT:
I was able to reproduce it with an empty project.

Should I post the link here or should I send it over by mail? If so, where should I send it to?
Reply
#4
(28-05-2020, 09:10 AM)monokel Wrote: Yes, the same thing is happening when I use the same values for maximum allowed timestep and fixed timestep.
It is also happening, both, in Editor and in Build (Desktop).
Specs shouldn't be much of a problem:
i7-7700k 4x4.2Ghz
GTX 1070
32 GB Ram

I could try to setup a small repro project, i guess that would be helpful?

EDIT:
I was able to reproduce it with an empty project.

Should I post the link here or should I send it over by mail? If so, where should I send it to?

Hi,

Please send it to our support email: support(at)virtualmethodstudio.com, I'll take a look at it asap.
Reply
#5
Hi there,

I was unable to reproduce the spikes using your sample project. Tried on 3 different machines:
- PC (Windows 10, Corei7 4771, 3.5Ghz 8 cores)
- Mac Pro (mid-2016)
- Mac Book Air (2014)

The profiler looks very similar in all 3:
[Image: xz8gVzg.png]

Edit: Out of luck, I was able to reproduce the spikes in Windows by having Chrome open and playing a couple videos on the background:
[Image: gpUJ95y.png]

Obi spawns one thread less than the CPU's max thread count, up to a maximum of 7. Since Chrome is heavily multithreaded too, many logic threads could be fighting for CPU time, forcing Obi to wait for its threads to be given some CPU time. This would of course happen with any other multithreaded application, not just Chrome. Unfortunately there's not much we can do to prevent this, as cpu time must be shared among all threads running.
Reply